
- Start
- Data driven cities - the potential
- The mapping story: Education mapping as a pilot case study
- Digitizing Social Innovation - the methodology
- Learn: Knowledge and planning phase
- Enrich: Data phase
- Visualize: Mapping phase
- Engage: Analysis, engagement and iteration phase
- Act: Evaluation and action taking phase
- Key lessons learnt
- About the author(s)
- References
Published 15.11.2021
Mapping Social Innovation
The Case of Digitizing Social Innovation in Egypt to Support Sustainable Development
Keywords: Innovation mapping; digitization; urban analytics; social innovation
Abstract:
Utilizing the data generated by modern technology can provide evidence for supporting scaling up of solutions tackling key urban development challenges. In this article, the author presents the project Digitizing Social Innovation (DSI) in Egypt which focuses on mapping Egypt’s innovations to highlight innovation clusters and gaps in resources and support. Spatial data adds the geographic dimension spotting geographic inequalities and creating visibility and channels for connection among innovators. The author adopts a hybrid approach to mapping that connects citizens generated data to top-down national development strategies as well as low and hi-tech tools. The author developed a five-step methodology: 1) Learn: Planning phase, 2) Enrich: Data phase, 3) Visualize: Mapping phase, 4) Engage: Analysis, engagement, and iteration phase, and 5) Act: Evaluation. The article ends with lessons learnt on creating evidence for development and connecting citizen generated data to census data.
Data driven cities - the potential
Scarcity of data is no longer the challenge of the 21st century. On the contrary, the challenge is how to efficiently utilize the data generated by modern-day technology to tackle the most stressing development gaps and problems. Data can provide the guidance and the evidence needed for supporting the scaling up of entrepreneurship and innovation. Spatial data adds the geographic dimension in perspective, shedding light on geographic inequalities, highlighting where gaps and opportunities are, and creating visibility and channels for connection among innovators.
Utilizing data is crucial for development in Egypt. It would help to create evidence to best match the limited resources to the high demand and rising needs, supporting the scaling of social innovation, and linking and strengthening the ecosystem.
Data utilization is gaining attention globally to efficiently target the sustainable development goals. Efforts on producing and utilizing data are now also democratized to the public where we see around the globe citizen generated data (CGD) projects striving to fill development gaps.
With the help of data, RISE Egypt aims to bridge this gap and create the connection between local innovations, national development strategies, and sustainable development goals. RISE Egypt is a think- and do-tank that promotes collaboration across sectors and facilitates important conversations between stakeholders in the private sector, civil society, and policymaking communities. In 2017, RISE Egypt launched the first in a series of Solutions Summits in Egypt, bringing diverse stakeholders together in a platform for action to help scale the work of social impact enterprises using evidence-based and collaborative approaches. RISE’s newest project is the Library and Ecosystem Engagement Portal (LEEP) for Collaborative Impact, which is a direct outgrowth of work done with ecosystem stakeholders in the design and implementation of the 1st RISE Solutions Summit.
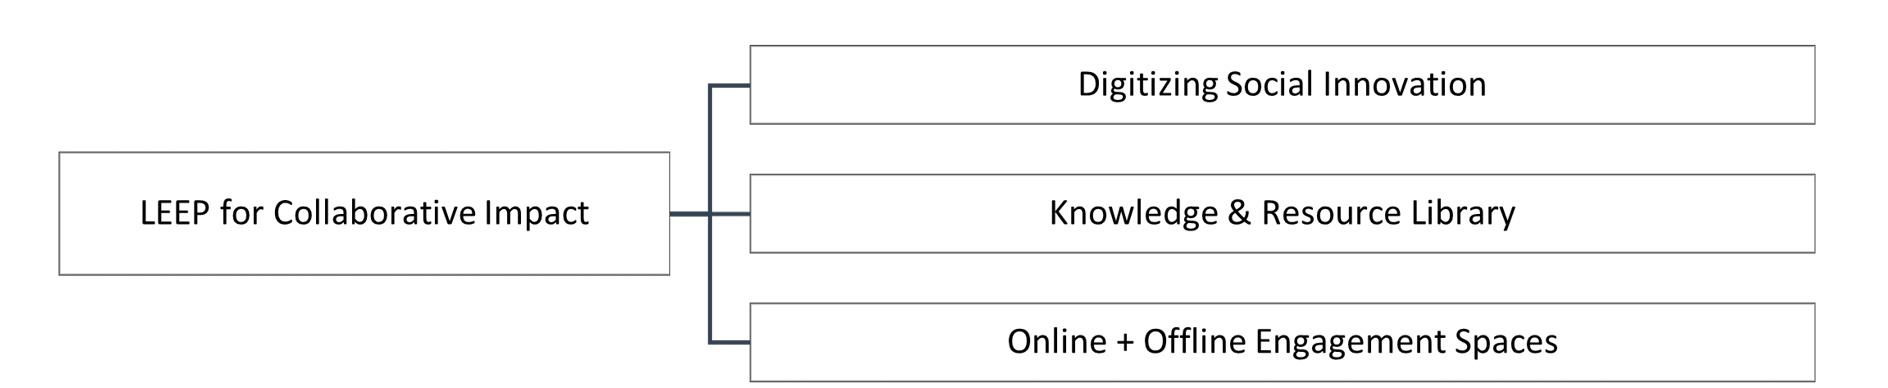
Utilizing data for informed decision-making is one of the key objectives of LEEP for Collaborative Impact in general and the mapping of social innovation in Egypt in specific. LEEP will be an online and offline societal platform to integrate the social innovation ecosystem across sectors, by providing a digitized crowdsourced map of the social innovation space, knowledge products, access to non-financial resources, and avenues for online/offline engagement. This platform will enable social enterprises to more efficiently and effectively scale-up and enable collaborations to emerge that may not otherwise be possible without the visibility of clear gaps and opportunities for cooperation that become clearer through mapping and centralization of key resources.
LEEP for Collaborative Impact has three main components as central to its activities:
The mapping story: Education mapping as a pilot case study
RISE Egypt started mapping innovation in its 1st Annual Solutions Summit for Evidence-based Innovation and Investment, which focused on the education sector under the main theme of scaling evidence-based innovation and investment. The need for a cohesive map of the education ecosystem in Egypt crystallized after a series of focus groups engaging stakeholders from the ecosystem pre-summit. The mapping pilot was done over the course of the two-day summit in November 2017. The objective of mapping education innovation was to: a) develop a holistic view of the education scene in Egypt, b) identify gaps where there is limited attention and intervention (geographic and/or sector based), c) avoid replication of existing solutions (re-inventing the wheel), d) help spur partnerships and collaborations between different stakeholders when common grounds are identified, and e) make data available and accessible.
The collaborative map of the education ecosystem that was developed during the Summit included different types of education interventions spanning across Egypt. The total number of education interventions mapped during the summit exceed one hundred interventions, spanning most of the governorates, with 154 locations in total around Egypt. The mapping cards collected represented a variety of education interventions. The mapping activity was not only limited to the participants of the Summit but also allowed for mapping education interventions not represented at the Summit via participants including interventions through referral/snowballing crowdsourced knowledge for education innovations throughout Egypt.
One of the key observations of the mapping was the apparent geographic disparity, with more than 50% of the education interventions mapped located in Cairo only, leaving the rest of Egypt excluded.
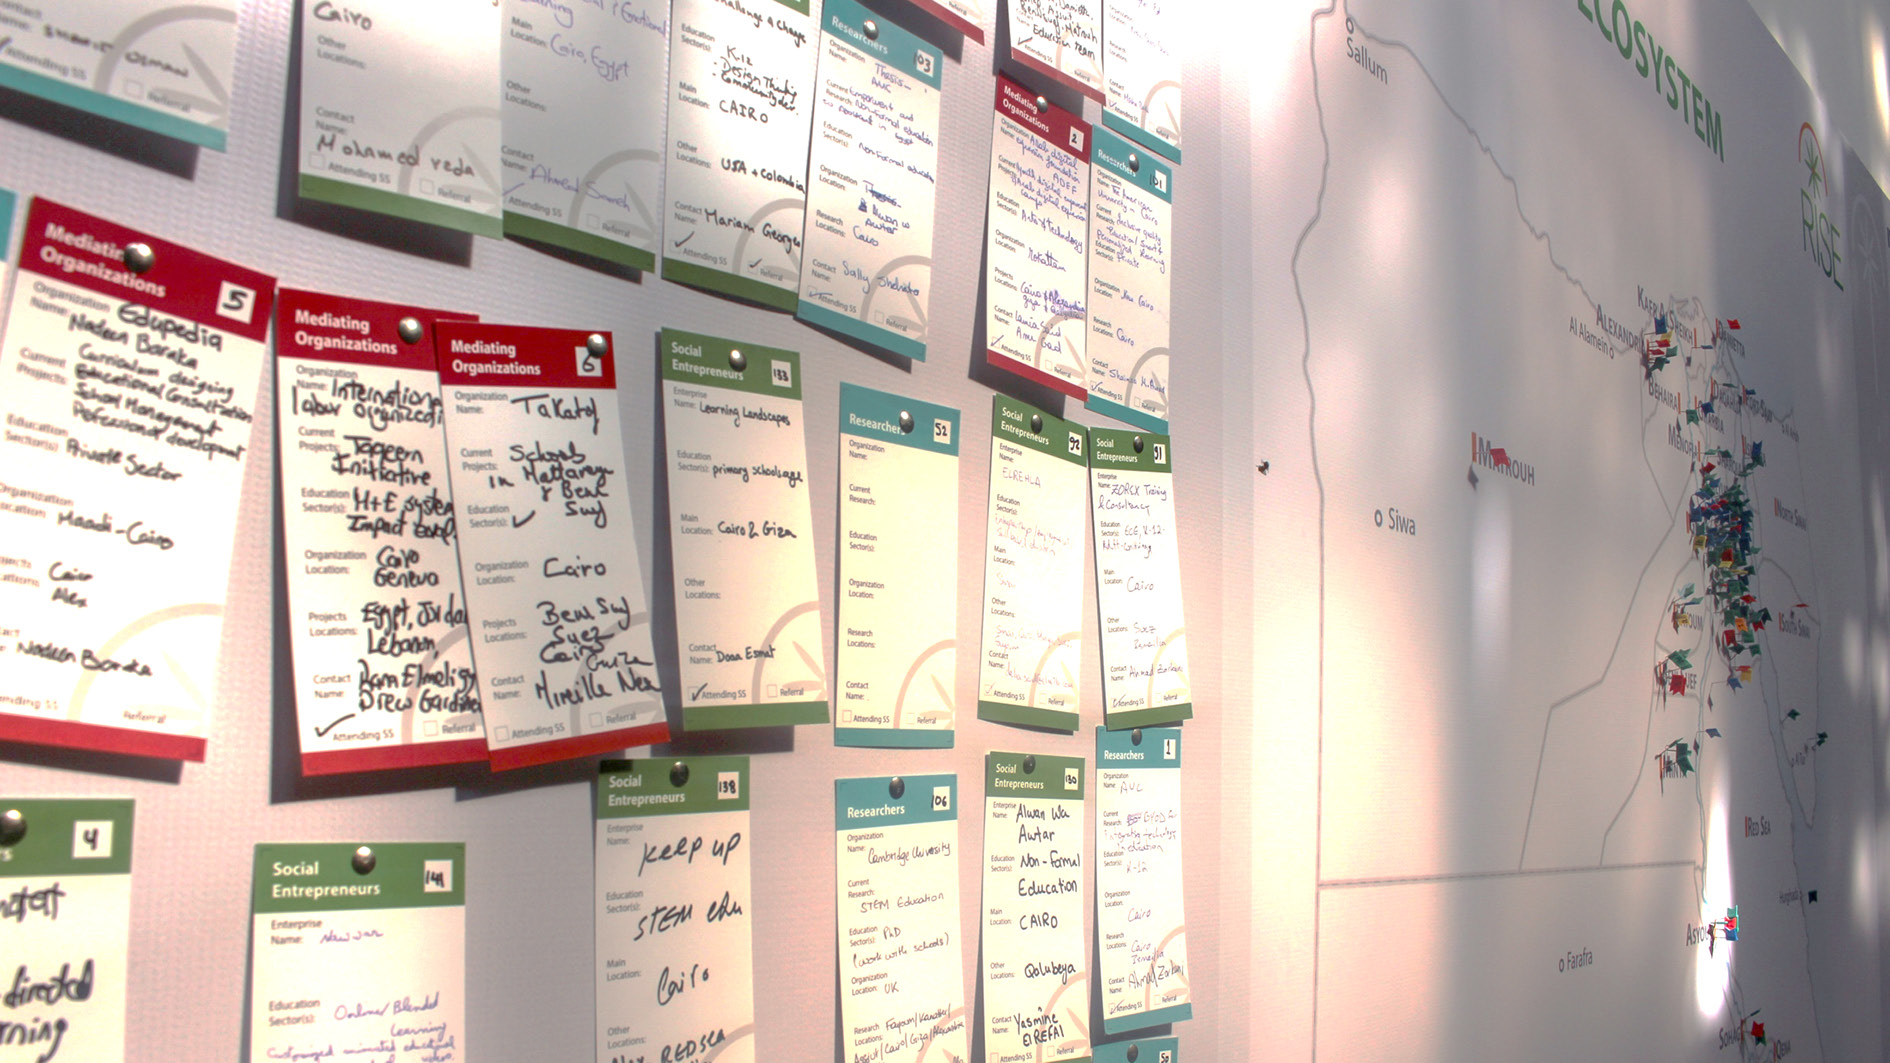
It is vital to highlight this could have been due to selection bias of participants being mostly from Cairo, however, the observation of innovation being clustered in Cairo was a discussion that the map triggered and there were a lot of consensuses confirming the reality of this observation (Figure 2). The level of engagement and interaction from the participants with the map which was printed on one of the summit venue’s walls (Figure 3) as well as the desire to carry on with the mapping exercise further are indicators for the high interest for citizen to citizen (C2C) collaboration in this space.
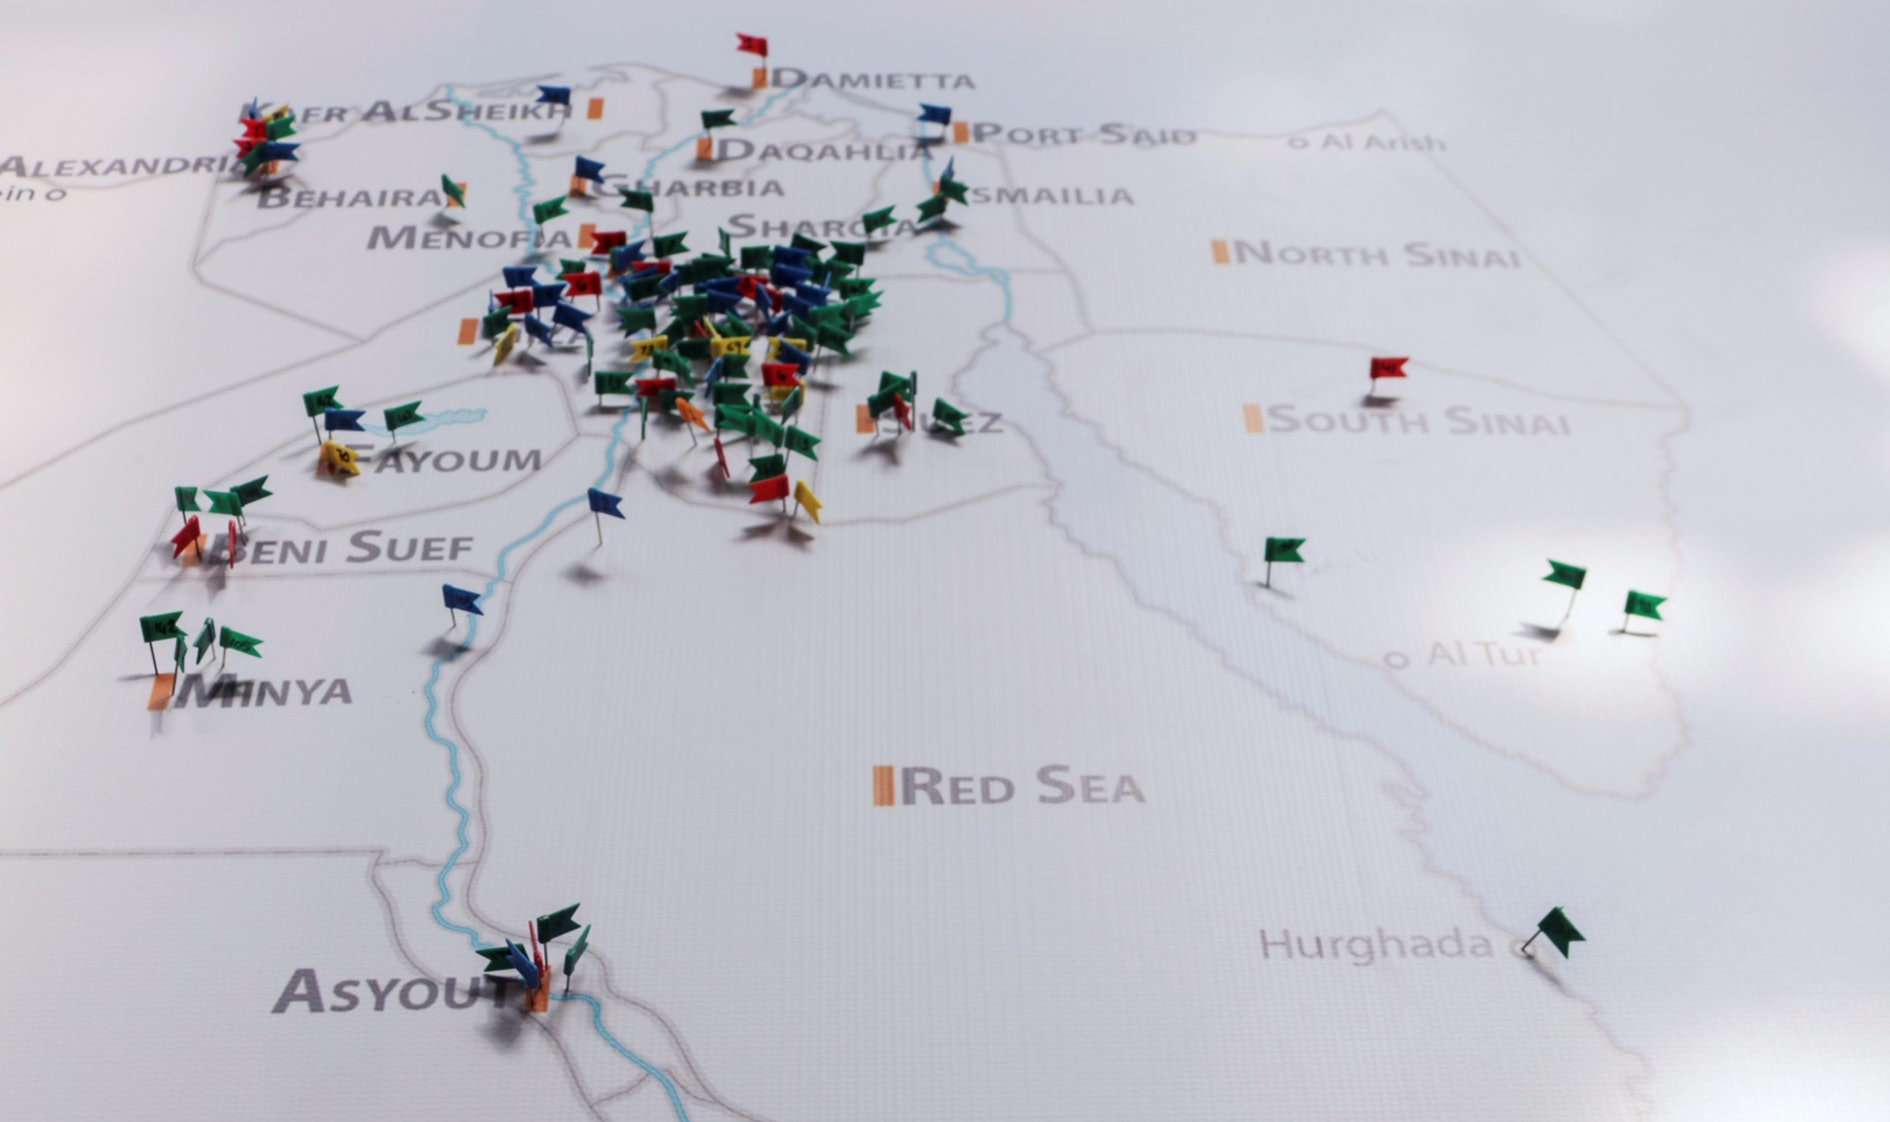
Source: Participants at 1st Annual Solutions Summit for Evidence-based Innovation and Investment / RISE Egypt.
Source: Participants at 1st Annual Solutions Summit for Evidence-based Innovation and Investment / RISE Egypt.
Source: Participants at 1st Annual Solutions Summit for Evidence-based Innovation and Investment / RISE Egypt.
Source: Participants at 1st Annual Solutions Summit for Evidence-based Innovation and Investment / RISE Egypt.
During and after the summit, we received a lot of positive feedback on the mapping experience and also an expression of the need to continue mapping further using digital tools. RISE Egypt also found great value in the digitization of social innovation. In fact, digitization of social innovation is crucial for the following reasons: a) it allows for enriching data with geospatial information, b) it spotlights figuring out where development and innovation gaps exist, c) it highlights areas for growth opportunities, d) visualizing location data enables the ecosystem to discover patterns and correlations, and e) the process creates new evidence for development.
Digitizing Social Innovation - the methodology
Digitizing Social Innovation (DSI) is a central activity of the LEEP for Collaborative Impact portal which focuses on visually mapping innovations by sector and stage, enabling stakeholders (e.g. entrepreneurs, investors/donors, researchers, capacity-building organizations) to see one another and have a clear starting point for working together. The primary stakeholders of the map are the entrepreneurs themselves.
DSI is based on a five-step methodology that guides the mapping of social innovation in Egypt. These five steps include:
- Learn: Knowledge and planning phase
- Enrich: Data phase
- Visualize: Mapping Phase
- Engage: Analysis, engagement, and iteration phase
- Act: Evaluation and action taking phase
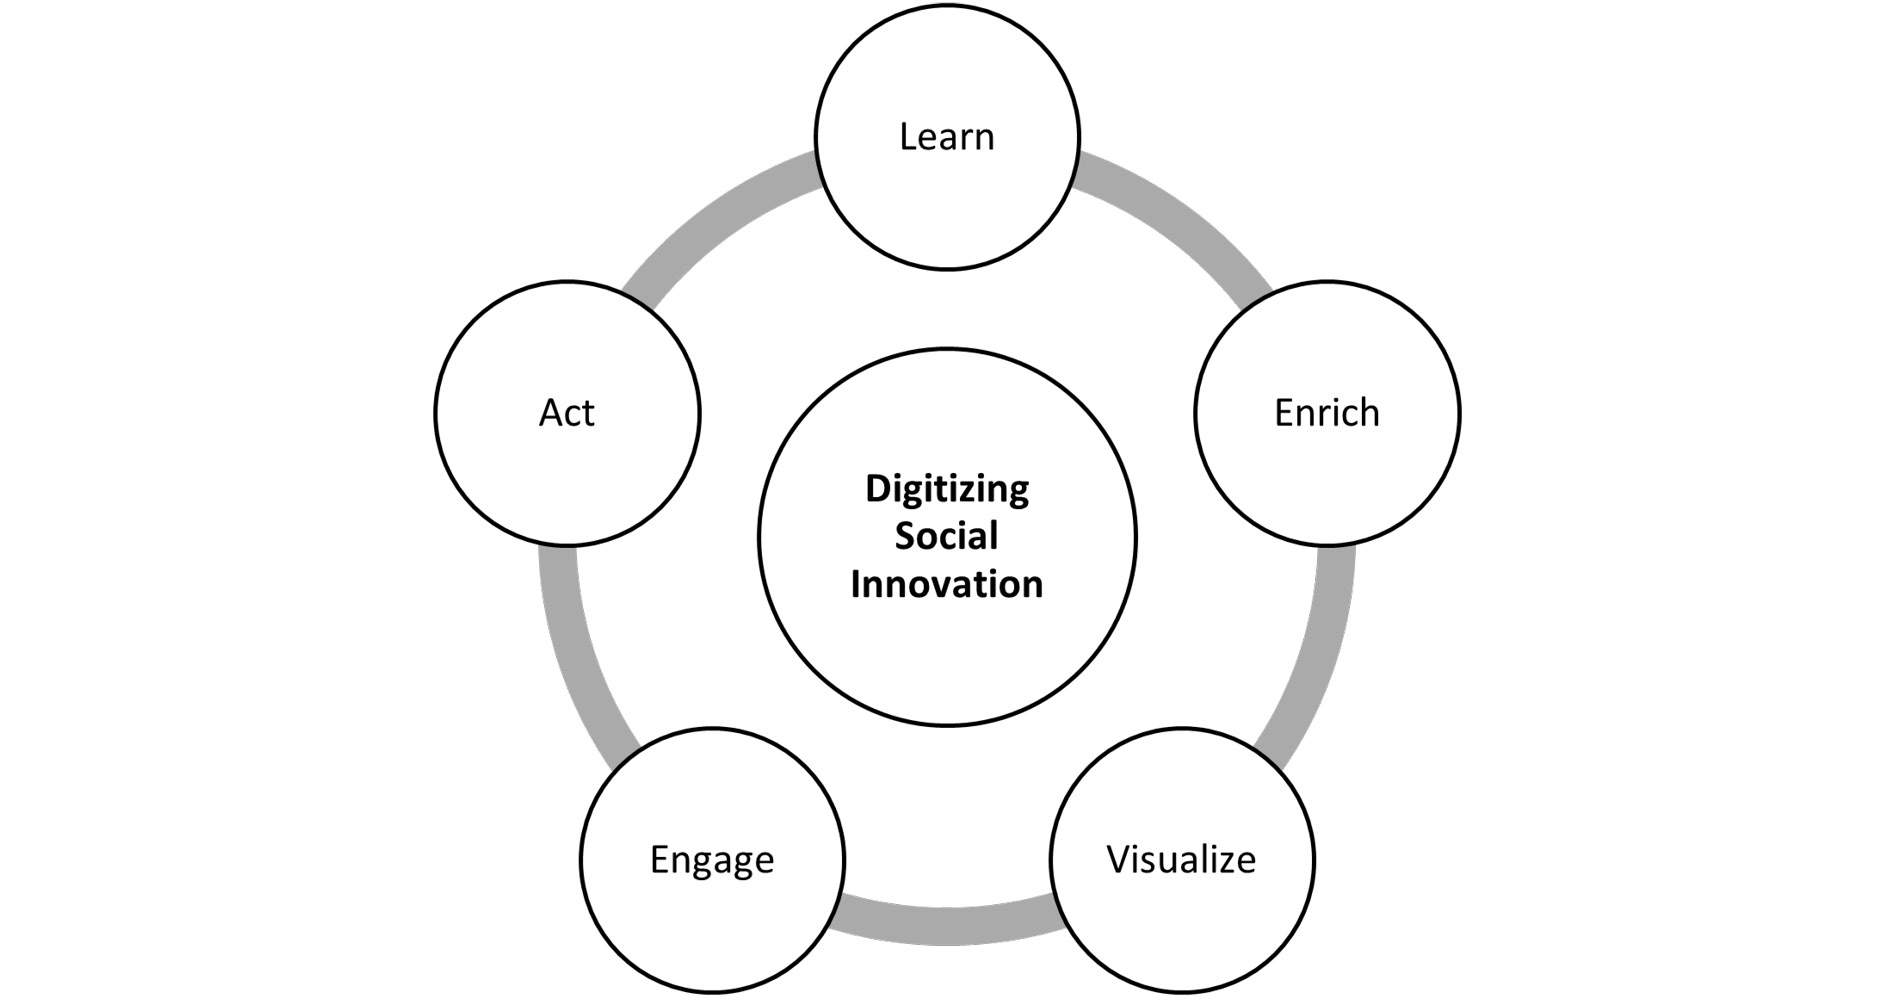
Source: Author adapted from the methodology on location intelligence by CartoDB Inc.
Source: Author adapted from the methodology on location intelligence by CartoDB Inc.
Learn: Knowledge and planning phase
The Learn phase included multiple activities that focused primarily on knowledge and network building in addition to planning and designing timelines and resources needed for the digitization of social innovation in Egypt. This phase consists of 4 key activities:
a) outreach to local and global learning partners to gain knowledge and insights from organizations that deal with mapping from the standpoint of policy, research, and practice, b) brainstorming, reflection, and debriefing on the key lessons learned and their relevance to the Egyptian context; exploring what works and what does not c) creation of a mapping methodology and a plan of action, and d) developing collaboration strategies with the various partners (ongoing process).
RISE Egypt held multiple stakeholder group meetings in Egypt with both stakeholders specialized in mapping as well as with entrepreneurs and innovators. The objectives of the mapping meetings are to: a) exchange knowledge and practices around mapping social innovation in Egypt, b) explore collaboration chances with other mappers in Egypt, and c) confirm the need for a cohesive map of innovations in Egypt. In addition, learning trips to some key global stakeholders in the fields of mapping, social innovation, and development took place in May 2018 to explore opportunities for learning and collaboration to build an Egyptian social innovation ecosystem portal based on global best practice.
Enrich: Data phase
From the Learn phase, we jumped into the enrichment phase, given that we already have the data on education innovation gathered in the 1st RISE Annual Solution Summit. However, during the Learn phase, we decided to follow a sector-agnostic approach. Instead of phasing in the mapping of innovation in Egypt by sector, we decided to take the time to grow the data set through gathering more data on all sectors of innovation and then developing one cohesive map of all types of innovations. We followed the following process:
Approaches to capturing data on social innovation. We have adopted three key approaches to gather data on social innovation across sectors in our aim to balance the use of hi-tech tools and approaches learned through global connections and exposure, as well as building coalitions and networks in Egypt. One approach is to connect with other mediating and capacity building organizations in the country to build alliances and to collectively compile data sets of social innovations across the country. We refer to this approach as the branching approach since it allows us to discover the networks of the networks; it capitalizes on already established data sets and standalone networks of social innovations developed by capacity building organizations with which they interact. This branching approach allows us to discover where support has been offered by the sector and geography. It allows us to also see the collective impact of ecosystem support organizations. However, it does not necessarily give us an accurate snapshot of all the social innovations across the country, since the innovations captured through this process are ones that have already been seen by existing organizations. We therefore also wanted to include a process that allowed us to capture potentially unseen innovations that exist but have never formally interacted with the current entrepreneurship ecosystem.
The second approach, therefore, is a snapshot of the social innovation ecosystem’s online presence in Egypt. In this approach, we captured the online publicly available data of innovations that had used in their description/about section a list of keywords identified by us as being correlated with social innovation. After discussions with social innovators on the presence (or lack of) online information on startups and entrepreneurship in Egypt, we came to realize that an entrepreneur is more likely to create a Facebook page about their business than to start a website. That is why the main online presence researched was the Facebook pages. This approach allowed us to have an unbiased, decentralized, wide picture of social innovation in Egypt. On the downside, however, this process required the time-consuming step of vetting and filtering lists of unseen social innovations to verify that the pages identified do in fact represent social innovation startups. Additionally, in this process we have had to undergo thorough filtration of 7000+ entries which we narrowed down to only 500+ entries after doing primary research contacting the enterprises and verifying that their essence is a social innovation solution.
The third approach is a crowdsourcing approach. As inspired by the pilot case study in RISE Egypt’s 1st Solutions Summit where the whole mapping experience was based on offline crowdsourcing, we decided to use digital crowdsourcing tools that could be used during online and offline engagements with the entrepreneurs.
Census Data. The use of some key development indicators from census data enriches the map, for it allows the viewer to comprehend the development context on a national level. It also plays a great role in identifying gaps and opportunities for development. For instance, when looking at education innovation, it is vital to enrich it with census data on education mapped by governorate since this would allow the viewer to realize where the education innovation exists and where the need for development in education exists thus helping entrepreneurs know where to expand, helping education investors know where to direct their resources, and helping mediate organizations working in education know where to develop their programs. CAPMAS is the main source for accessing census data in Egypt. For instance, one of the key CAPMAS census data indicators that can support a map of education innovation is the literacy levels, percentage of high school graduates, or other. Mapping these indicators against a map of education innovation across Egypt would show where innovation is meeting demand, where it’s not, and where gaps and opportunities exist.
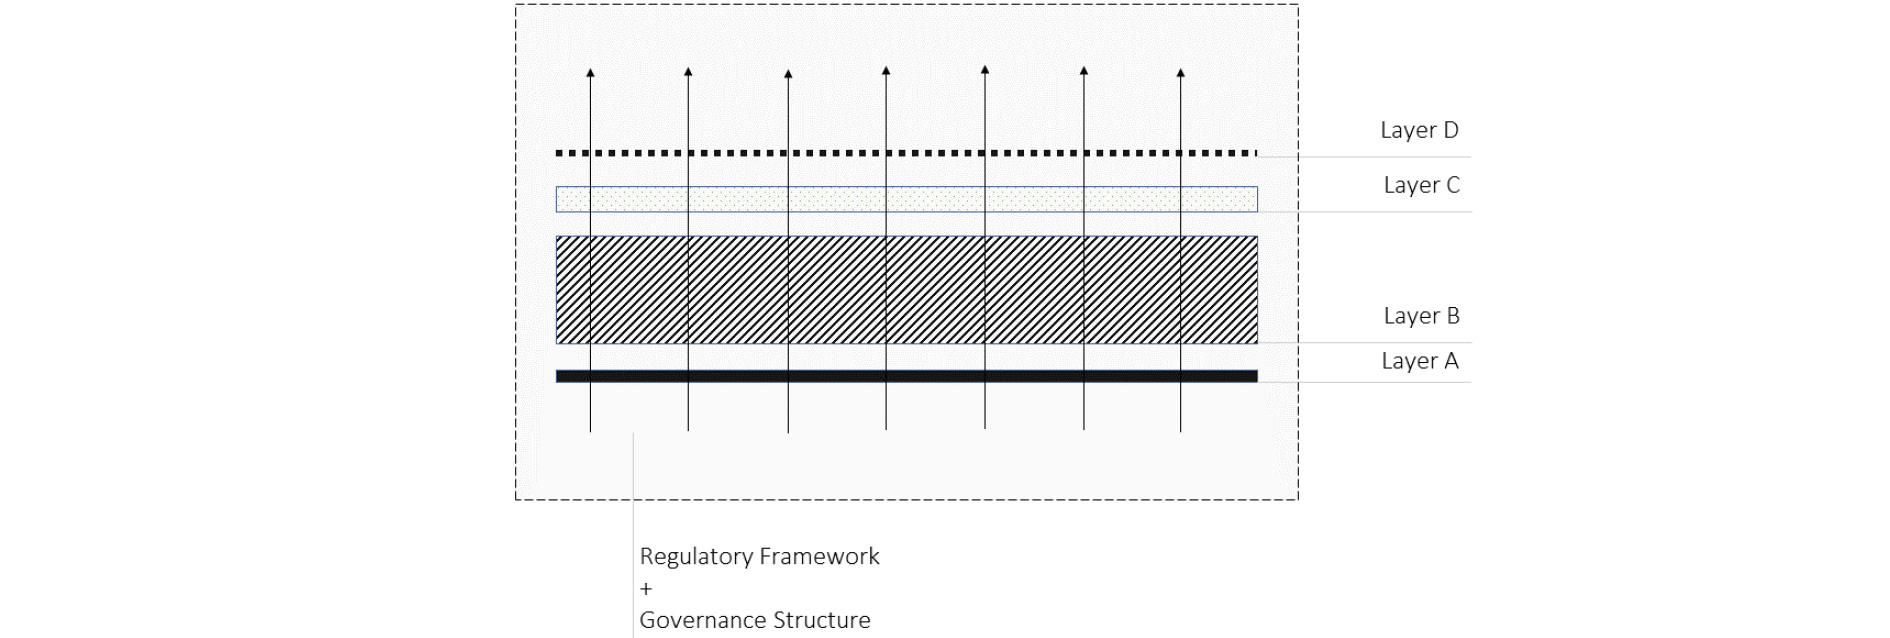
Approaches to data enrichment. The social innovation map consists of four layers. Layer A is the geographic information/spatial data of Egypt serving as the base map layer. Layer B is the innovation data which is the core of the map. As explained earlier, the innovation data is captured through three approaches: the branching approach, the snapshot approach, and the crowdsourcing approach. Layer C is the national census data which provides the context in which the innovation is operating. Layer D is the dynamic interface layer that represents the customizable interface. It mainly reflects the interaction and customization through visualization of the first three layers (A, B, and C).
Visualize: Mapping phase
We have explored digital tools for mapping and realized the potential of location intelligence for the development of the innovation ecosystem in Egypt. Initially, the potential of geographic information systems (GIS) was explored, and soon after we realized the powerful analytics of location intelligence software, especially when it comes to layering data and producing analyses. We think it is a powerful tool for our objective to make informed decisions about entrepreneurial growth and investments. The approach we are following for visualizing the map is to: a) create a dynamic overlay of the innovation data set and the relevant census data indicators, and b) create an interactive interface that allows different personas to interact and customize the map visualization with the help of drop-down menus.
Engage: Analysis, engagement and iteration phase
In this phase, decisions on the type of data analysis are made. To make decisions about which data analysis functions we prioritize, we engaged entrepreneurs directly and will continue to engage in order to tie these decisions to upcoming community engagement strategy across governorates. In other words, the analysis comes hand in hand with the engagement of the entrepreneurs as primary stakeholders in specific and other map users in general to test and verify that the map addresses their need and offers the potential they are looking for. By taking a participatory approach, we guarantee that the map meets the needs of entrepreneurs to connect with one another, access needed resources, and gain knowledge and insights that are valuable for them to scale up and operate their enterprises more efficiently.
This analysis and engagement process require recurrent cycles of iteration for the map design and data input. Balance between online and offline engagement is one of the key approaches that RISE Egypt adopts in order to ensure deep connection as well as wide outreach across the country. While online engagement ensures widespread outreach across the governorates and sustainability of the engagement, offline engagement is crucial for the ecosystem connections to be grounded and deepened.
Act: Evaluation and action taking phase
The social innovation map is expected to motivate researchers to ask new questions and investigate the various observations that become clear after gathering and visualizing data on the map. It will also be a place in which innovators can connect with researchers in order to collaborate on applied research questions that can help entrepreneurs take data driven approaches to scaling up. The map is also expected to support donors and investors following an evidence-based approach to development because it will help identify where the gaps of support and development are, as well as where opportunities for scale-up exist. Furthermore, as part of the Act phase and similar to the Learn phase, global-local connections are part of the focus where sharing knowledge of the mapping process and the mapping outcome becomes a responsibility to the global development ecosystem. The LEEP library is also another reflection of this increased knowledge sharing as part of LEEP. In brief, the key 3 outcomes of the Act phase are a) motivating new research to develop and increasing knowledge sharing, b) supporting evidence-based investment, and c) communicating learning outcomes with the local and global context. The project is expected to enter the Act phase once the web development of the library portal is finished and the map and portal become available online.
Key lessons learnt
The case study is still under progress as part of the LEEP for Collaborative Impact project. Some of the key lessons learnt so far is the importance of balance between hi-tech and low-tech methods and approaches whether that be in data gathering or in engagement of innovators.
Hi-tech digital approaches have proven to give wide outreach and unbiased results; however, they require thorough vetting to ensure quality. Low-tech offline approaches are usually limited to already supported innovations, but ensure deep conversations and grounded connections.
Another key lesson learnt is the importance of building bridges between local grassroots development efforts, national development strategies, and the global sustainable development goals (SDGs). There is great potential to empower the social innovation ecosystem by connecting citizen-generated data to national development data supporting the SDGs, thereby creating important cross-sector collaborations that catalyze visibility, accessibility, and connectivity to critical resources that enable the scaling up of the entire social innovation ecosystem in Egypt.
References
Further information on the projects mentioned in the article:
LEEP for Collaborative Impact: https://play.google.com/store/apps/details?id=com.riseegypt.leep&hl=en_US&gl=US.
RISE Egypt: https://www.riseegypt.org.